|
| RockWorks - Logs, Log Sections and Log Maps |
 |
| Create individual logs or multi-log cross sections and maps in 2D and 3D. Arrange log columns using the interactive design window. RockWorks displays both vertical and deviated/inclined wells. |
| |
RockWorks 2D and 3D Logs and Log Diagrams
Include any combination of the following borehole data items in your RockWorks logs. |
| |
- Well name
- Depth labels
- Stratigraphy colors/patterns/text
- Lithology colors/patterns/text
- 1-4 interval-data bargraphs
- 1-4 point-data curves
- Aquifer levels
- Well symbols and pattern blocks
- Fractures (2D tadpoles, 3D discs)
- Raster images (BMP, JPG, TIF, PNG, WMF, EMF)
- Vectors (2D tadpoles, 3D arrows)
- Well construction diagrams
|
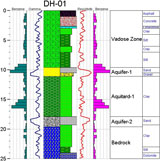
2D log with lithology and stratigraphy columns/descriptions, curves (point data), histograms
(interval data) and well label |
RockWorks allows you to view your observed downhole data in individual or multiple log diagrams, in 2D and 3D. |
| |
Single Logs, 2D
- Display your downhole data in individual strip logs
|
 |
| |
- Logs can be vertical, inclined, horizontal, or deviated
|
 |
| |
Multiple Log Sections and Profiles RockWorks offers both projected log sections and hole to hole log sections:
- Projected log sections display vertical, inclined, or deviated wells, as they are projected perpendicularly onto a single section plane. A user-defined clipping distance determines how many logs will be included.
- Hole to hole sections display vertical logs only, and are created by selecting individual wells, in any order, that are to be displayed from left to right in the section. (You can also include stratigraphic interpolations in stratigraphic log sections.)
|

Log section displaying stratigraphy and quantitative downhole data |
| |
Multiple Log Maps
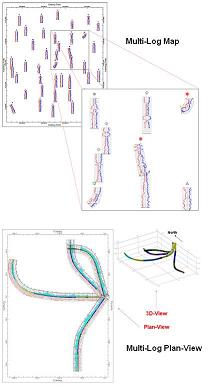
- Use RockWorks to create a plan view diagram of deviated or angled boreholes, or a log map of vertical boreholes.
|
 |
| |
2D Log Designer
- Use the 2D log designer to define the log column arrangement. The Striplog Layout Window includes option for data filtering and resampling, and log clipping.
|
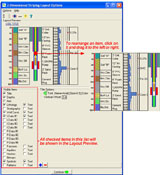
The 2D log designer window |
| |
Single Logs, 3D
- Display your downhole data in individual logs in the interactive 3D viewer, where the different log items can be turned on and off in the display.
|
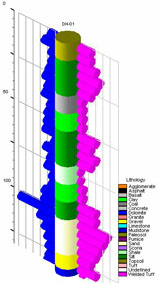
3D geotechnical log |
| |
Multiple Logs, 3D
- Display multiple wells in the 3D viewer, where entire logs as well as their components can be turned on and off in the display.
- Rotate, zoom, stretch the view, and save the logs for appending to other 3D diagrams.
|
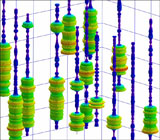
3D geophysical logs showing resistivity values (point data) |
| |
3D Log Designer
- Use the 3D log designer to define the layout of your 3D logs.
|
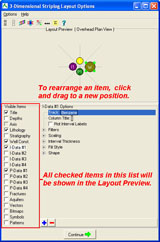
The 3D log designer window |
| |
|