|
| Grapher - Axes |
 |
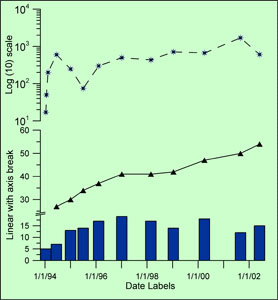
| Grapher has four axis scales: linear, logarithmic (base 10), natural logarithmic, and probability. Use Grapher's default settings or specify custom settings for all axis parameters. Set the axis scale, change the axis length and starting position, add additional or duplicate axes, change axis limits, enter an axis title, add grid lines, break the axis, or hide the axis on your graph. On each axis, you control the major and minor tick frequency and spacing or you can use Grapher's default settings. If the data uses date and time as one of the data columns, axis labels are automatically generated using dates and times. In addition, manual date/time labels can be created or labels can be read from a worksheet, allowing you to use any type of tick labeling. |
| |
 |
| |
|
|
|
|
| Helping Communities |
|
Project Review
Ecoseal reviewed the ACIAR Project on Sustainable Agriculture in Saline Environments through Serial Biological Concentration, which was carried out in Pakistan and Australia. |
|
| Read More |
|
Seawater Intrusion Model for the Island of Kayts, Sri Lanka
Assessing sustainable water supply options for Kayts to limit the impact of saline groundwater upconing and saltwater intrusion along the northwest coast of Sri Lanka. |
| Read More |
|
Groundwater Management Model for the Lower Murray, Australia
The aim of this project was to develop a groundwater management model which was used by natural resource managers and the community to better manage the groundwater resources of the Lower Murray. This region has been designated as a potential high-risk aquifer system.
|
| Read More |
|