|
| Grapher - Curve Fits |
 |
| Curve fitting routines help depict trends in your data. Select pre-defined fits or define a custom fit to add to the graph. Display fits for Line and Scatter Graphs, Step Plots, Polar Graphs and Histograms. There are 11 pre-defined curve-fitting algorithms in Grapher: |
| |
|
|
|
|
|
|
- Orthogonal Polynomial Regression
|
|
|
|
- Gaussian (available only for histograms)
|
|
|
| |
Associate any number of fits with a single curve. Change the line style, color and width for each fit. Applicable statistics are available for each fit. The resulting statistics are copied to the clipboard or displayed in a report window. Export fit curve data to a worksheet to calculate additional statistics. Change the range of data used to create the fit curve and the range of values to display the fit curves individually.
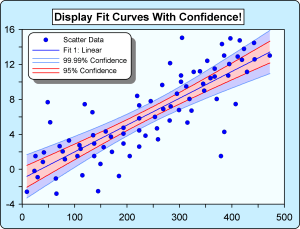
Add confidence intervals to your fit curves to show the degree of confidence that is in the fit. Fill between confidence upper and lower bounds to highlight the certainty. |
| |
 |
| |
| |
|
|
|
|
| Helping Communities |
|
Project Review
Ecoseal reviewed the ACIAR Project on Sustainable Agriculture in Saline Environments through Serial Biological Concentration, which was carried out in Pakistan and Australia. |
|
| Read More |
|
Seawater Intrusion Model for the Island of Kayts, Sri Lanka
Assessing sustainable water supply options for Kayts to limit the impact of saline groundwater upconing and saltwater intrusion along the northwest coast of Sri Lanka. |
| Read More |
|
Groundwater Management Model for the Lower Murray, Australia
The aim of this project was to develop a groundwater management model which was used by natural resource managers and the community to better manage the groundwater resources of the Lower Murray. This region has been designated as a potential high-risk aquifer system.
|
| Read More |
|