|
| Grapher - Overview |
 |
Grapher is an easy to understand technical graphing package for anyone who needs to create publication-quality graphs quickly and easily. With Grapher, creating graphs is quick and easy.
Create one of more than 40 unique 2D or 3D graph types in Grapher 7! Customize any portion of any graph to make the graph completely unique to your situation! There are four different types of 2D graphs that can be created in Grapher: linear, bar, polar, and specialty graph types. In addition, many of these graph types are available with a 3D aspect. If you need an extra variable plotted on your graph, try one of the 3D XYZ graphs, the contour maps, or surface maps! |
| |
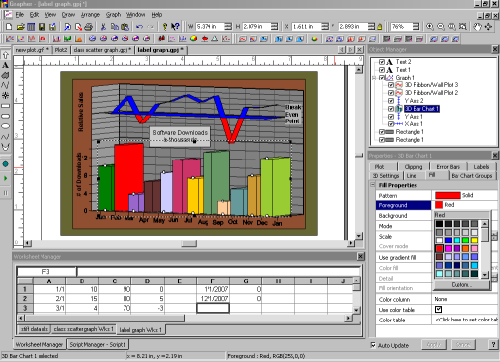
Create any graph you want in Grapher 7! Edit it quickly and easily
with the always-available Property Inspector. |
| |
| Graph Types Available |
| Linear Graphs |
Bar Graphs |
Polar Graphs |
Specialty Graphs |
3D aspect Graphs |
3D XYZ Graphs |
Contour and Surface Maps |
| Line plots |
Bar charts |
Polar plots (line/scatter) |
Box-whisker plots |
Ribbon/wall plots |
3D line/scatter plots |
XY Contour Data Map |
| Scatter plots |
Floating bar charts |
Polar class scatter plots |
Bubble plots |
Function plots |
3D class scatter plots |
XY Contour Grid Map |
| Class scatter plots |
Histograms |
Polar bar plots |
Hi-low-close graphs |
Step plots |
3D bar charts |
Contour Data Map |
| Step plots |
Category bar charts |
Polar function plots |
Pie charts |
Bar charts |
3D floating bar charts |
XZ Contour Grid Map |
| Function plots |
|
Rose diagrams |
Stiff plots |
Floating bar chart |
3D bubble plots |
Surface Data Map |
| |
|
Wind charts |
Ternary diagrams |
Histograms |
|
Surface Grid Map |
| |
|
|
Vector plots |
Pie charts |
|
Surface Function Map |
|
| |
- Create your own custom graphs by using the updated easy to follow Graph Wizard.
- Add legends, curve fits, annotations, and drawing objects to complete the graph.
- Organize your objects in the improved Object Manager and edit your graphs in the updated Property Inspector!
- Editing has never been this easy!
- Create templates to use the same graph settings with multiple data files.
- Save the graphs in Grapher 4, Grapher 5, Grapher 6, or Grapher 7 GRF formats or Grapher 4, Grapher 5 Grapher 6, or Grapher 7 GPJ formats to make sharing documents between colleagues easier than ever!
- Automate the graphing process with the included ScripterT program or with the Script Recording feature inside Grapher!
- Export graphs for use in presentations and publications in one of Grapher's many export formats, including PDF and EPS!
|
| |
|
|
|
|
| Helping Communities |
|
Project Review
Ecoseal reviewed the ACIAR Project on Sustainable Agriculture in Saline Environments through Serial Biological Concentration, which was carried out in Pakistan and Australia. |
|
| Read More |
|
Seawater Intrusion Model for the Island of Kayts, Sri Lanka
Assessing sustainable water supply options for Kayts to limit the impact of saline groundwater upconing and saltwater intrusion along the northwest coast of Sri Lanka. |
| Read More |
|
Groundwater Management Model for the Lower Murray, Australia
The aim of this project was to develop a groundwater management model which was used by natural resource managers and the community to better manage the groundwater resources of the Lower Murray. This region has been designated as a potential high-risk aquifer system.
|
| Read More |
|