|
| RockWorks - Fence Diagrams |
 |
| Create 3D cross sections or fence diagrams of interpolated lithology, stratigraphy, quantitative data, fractures, and aquifers. Include source log data, borders, and legends. |
| |
| ITypes of data that can be represented as fence diagrams: |
| |
- Lithology distribution
- Stratigraphic layers
- Quantitative data distribution (geochemistry, geophysics, geotechnical)
- Fracture proximities
- Aquifer surfaces
|
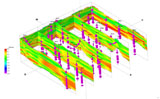
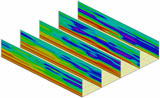
A fence diagram based on lithology data, with superimposed downhole data logs |
| |
| Panels are easy to draw in a map window; select from regular, pre-configured layouts or draw your own. Or, give the program a list of panel endpoints. |
| |
| 3D strip logs can be appended automatically. Automatic panel location maps are available. |
|
| Lithology Fences |
Display your interpolated lithology in fence panels
Include a lithology color legend and view volumes of the lithology types in the 3D window |
RockWorks fence diagram representing interpolated lithology |
|
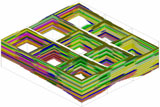
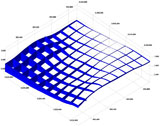
| Stratigraphy Fences |
- Display interpolated stratigraphic surfaces in fence panels, or display "straight" linear correlations
- Include a stratigraphy color legend
- Turn individual layers on and off
- Stratigraphic fences can be created in Shapefile format for display in ArcScene®
|
Stratigraphy fence diagram showing interpolated surfaces |
|
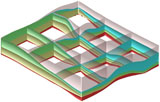
| Quantitative Data Fences |
- Display slices of your interpolated geochemistry, geophysical, geotechnical, or other quantitative data in 3D fence panels
- Include color legends
- Display in combination with an isosurface, and/or append stratigraphic surfaces for reference
|
Fence diagram from model of cone penetrometer data |
|
| Fracture Fences |
- Model fracture locations in 3D and display slices of the model as fence panels
- Append fracture discs on 3D logs
- Include a legend to colors and distances
|
Fence diagram taken from fracture data model |
|
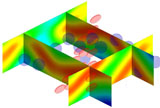
Aquifer Fences |
- Display aquifer surface and base in 3D fence panels
- Combine with an isosurface representing a contaminant plume
- Float a reference map above the image
|
RockWorks fence diagram representing interpolated lithology |
| |
|