|
| RockWorks - 2D and 3D Maps |
 |
| |
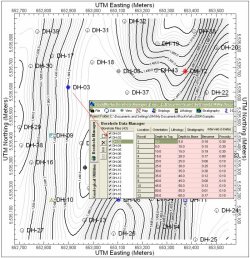
Borehole data based maps
Borehole location maps Geology maps Isopach maps
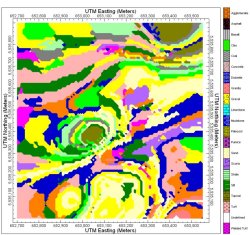
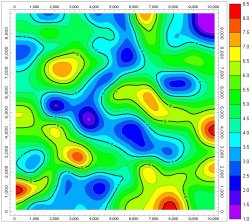
Contour maps
XYZ data based maps
|
 |
 |
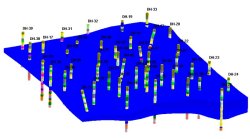
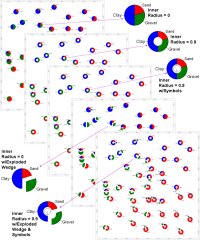
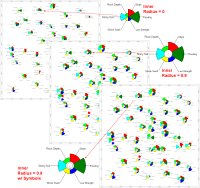
| Contoured borehole location map |
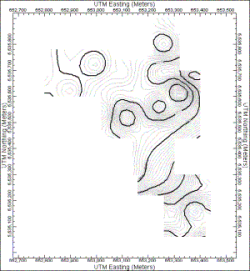
Grid data based contour map |
|
|
|
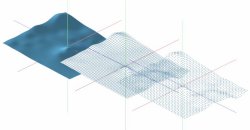
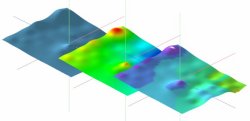
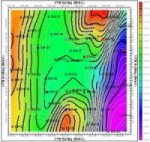
RockWorks contour maps
RockWorks 2004 let's you easily create feature-rich contour maps from your elevation (topographic) or other XYZ data:
Non-grid (triangulation-based) contour map
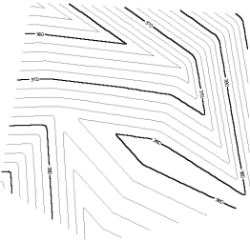
Triangulation based contour map
Grid-based contour map
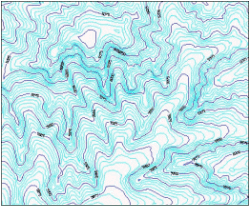
Grid based contour map
Color-filled contour map
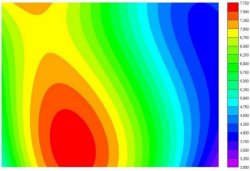
Color-filled contour map
Color filled contour map with conventional contour lines
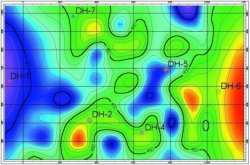
Color-filled contour map with conventional contour lines
Contour map with irregularly-spaced, non-numeric contour labeling
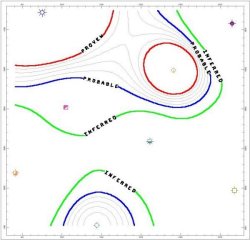
Contour map with irregularly-spaced, non-numeric contour labeling
Disable contours at clipping boundaries
Disable contours at clipping boundaries
RockWorks land grid maps
RockWorks 2004 has the following utilities available to process and display your land grid data:
Import and/or interpolate land grid coordinates
- Import section coordinates from commercial data vendors:
- IHS (Petroleum Information/Dwights) Tobin (Graphics Information ASCII-31 Format)
- Whitestar (Platte River)
- Interpolate section corners based on a known reference point
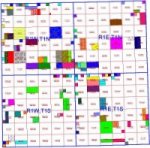
Section grid maps (township and range)
- Converts tables of land grid corner point coordinates to fully annotated section maps Automatically calculates and displays acreages
- Full control of plotting parameters such as labeling verbosity, colors, and font dimensions
Section grid or township and range map
Convert legal descriptions to local or global coordinates
- Convert tables of legal descriptions (e.g. well locations) into cartesian coordinates (longitude/latitude, UTM feet/meters)
- Accepts quarter/quarter, half-section, or footage-from-edge style legal descriptions
Lease ownership/expiration map
- Convert legal descriptions to cartesian coordinates based on land-grid database
- Control colors, patterns, font sized, etc
 Lease ownership and expiration map
RockWorks surveying tools
RockWorks 2004 has the following utilities available to process and display your surveying data:
Convert survey coordinates to XYZ
Convert bearing, distance, and inclination to XYZ values. Display as 2D maps and as 3D images.
Convert survey coordinates to XYZ
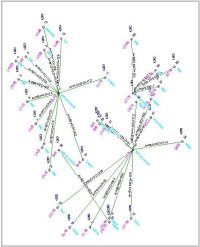
Determine known points
- Convert triangulation-based survey data to known points
- Compute locations by "shooting" at known points
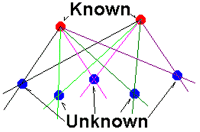
Determine known points
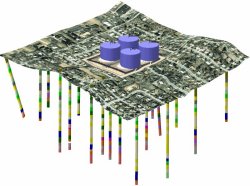
Downhole Survey
Create plan-view, profile, or 3D image of deviated boreholes.
|
| |
| |
| |
|
|
|
| Helping Communities |
|
Project Review
Ecoseal reviewed the ACIAR Project on Sustainable Agriculture in Saline Environments through Serial Biological Concentration, which was carried out in Pakistan and Australia. |
|
| Read More |
|
Seawater Intrusion Model for the Island of Kayts, Sri Lanka
Assessing sustainable water supply options for Kayts to limit the impact of saline groundwater upconing and saltwater intrusion along the northwest coast of Sri Lanka. |
| Read More |
|
Groundwater Management Model for the Lower Murray, Australia
The aim of this project was to develop a groundwater management model which was used by natural resource managers and the community to better manage the groundwater resources of the Lower Murray. This region has been designated as a potential high-risk aquifer system.
|
| Read More |
|